
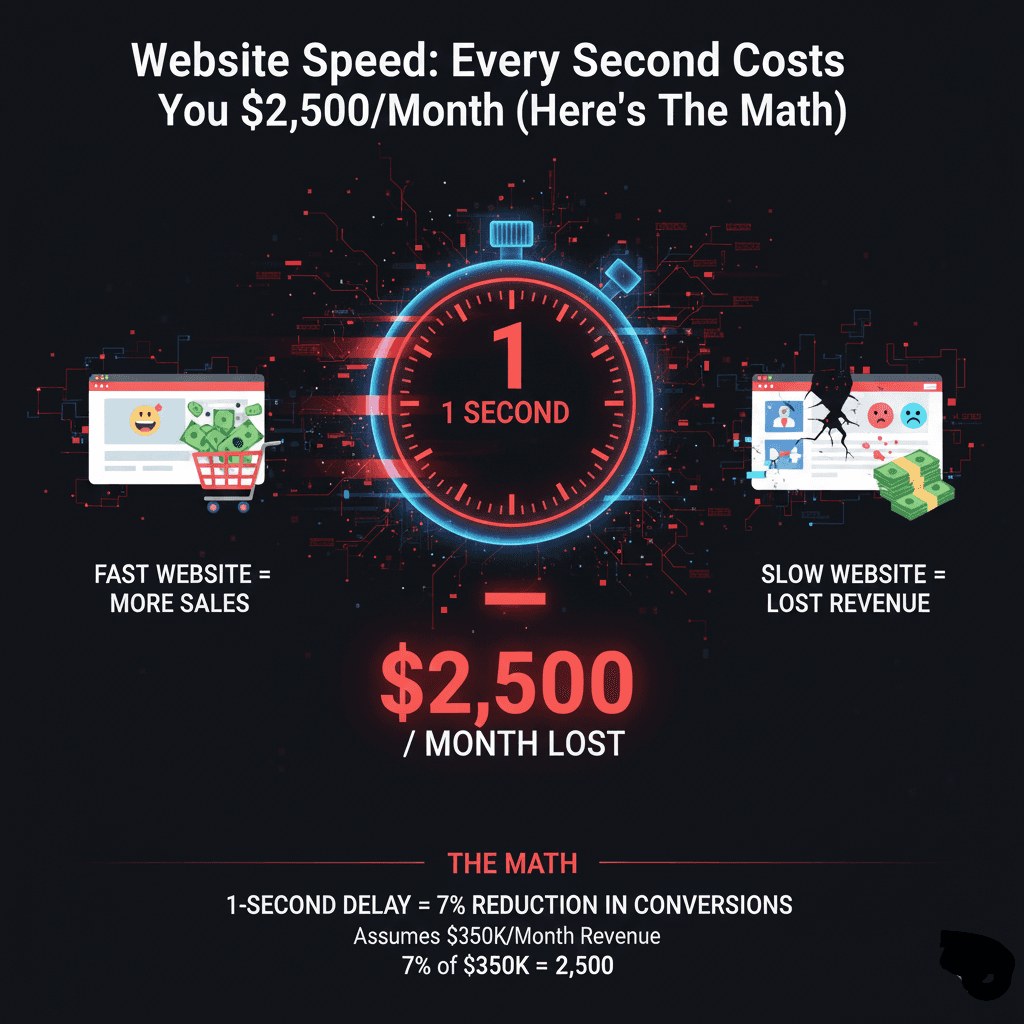
Website Speed: Every Second Costs You $2,500/Month (Here's The Math)
Sep 28, 2025
Your website takes 5 seconds to load.
Doesn't seem that bad, right?
Wrong.
That extra 2 seconds is costing you $30,000 a year.
Here's the brutal math behind website speed and why every second matters.
The 1-Second Rule
Studies in 2025 show something shocking:
A site that loads in 1 second has a conversion rate 2.5x higher than a site that loads in 5 seconds.
Let me show you what that means in dollars.
Your business:
10,000 monthly visitors
Average order value: $200
Current load time: 5 seconds
Current conversion rate: 1.2%
Monthly revenue: 10,000 × 1.2% × $200 = $24,000
If you had 1-second load time:
Same visitors: 10,000
Improved conversion rate: 3% (2.5x higher)
Same order value: $200
Monthly revenue: 10,000 × 3% × $200 = $60,000
Difference: $36,000 per month
That's $432,000 per year.
From speed alone.
The Real Cost Breakdown
Let's get specific about what slow speed actually costs.
Every Extra Second Costs:
1→2 seconds: -32% bounce rate increase
2→3 seconds: -40% bounce rate increase
3→4 seconds: -53% visitors abandon
4→5 seconds: -70% conversion drop
5→10 seconds: -123% bounce rate increase
Translation to money:
If you make $100K/month with a 3-second site...
At 5 seconds: You'd make $70K/month (30% loss = $30K)
At 8 seconds: You'd make $40K/month (60% loss = $60K)
Every second literally costs thousands.
The Mobile Speed Catastrophe
Here's where it gets worse.
60% of your traffic is mobile.
And mobile users are even less patient.
53% of mobile users abandon sites that take over 3 seconds.
Your desktop site loads in 4 seconds?
Your mobile site probably loads in 8-12 seconds.
You're invisible to mobile users.
The math:
6,000 mobile visitors/month (60% of 10,000)
53% abandon if slow = 3,180 lost visitors
3,180 × 2% conversion × $200 = $12,720 lost monthly
That's $152,640 per year just from mobile speed issues.
Real Business Examples
E-Commerce Store Case Study
Before speed optimization:
Load time: 6.2 seconds
Monthly visitors: 15,000
Conversion rate: 1.4%
Monthly revenue: $42,000
After speed optimization:
Load time: 1.8 seconds
Same visitors: 15,000
Conversion rate: 3.1%
Monthly revenue: $93,000
Increase: $51,000/month = $612,000/year
Cost of optimization: $8,000
ROI: 7,550% (paid back in 5 days)
SaaS Company Case Study
Before:
Load time: 4.5 seconds
Trial signup rate: 2.8%
Monthly signups: 840
Close rate: 10%
Monthly new customers: 84
After (2.1 second load):
Trial signup rate: 4.2%
Monthly signups: 1,260
Close rate: 10%
Monthly new customers: 126
Difference: 42 more customers/month
At $100 MRR per customer = $4,200 more MRR
Over 12 months with churn: $42,000 additional ARR
Investment: $12,000
ROI: 250%
The Google Penalty Nobody Talks About
Slow sites don't just lose conversions.
They lose rankings.
Google's Core Web Vitals are now ranking factors.
Sites loading under 2.5 seconds:
More likely in top 20 results
Higher click-through rates
More organic traffic
Sites loading over 4 seconds:
Pushed down rankings
Lower visibility
Less organic traffic
The compounding effect:
Slow site → Lower rankings → Less traffic → Less revenue
Even if your conversion rate was perfect, you'd still lose money.
What Actually Slows Down Websites
Most slow sites have the same problems:
Problem #1: Massive Images (60% of sites)
Using 5MB images when 200KB would work fine.
Solution:
Compress images (TinyPNG, ImageOptim)
Use WebP format
Lazy loading
Responsive images
Impact: 40-60% faster load times
Problem #2: Too Many Plugins (45% of sites)
WordPress sites with 40+ plugins installed.
Each plugin adds code. Code slows things down.
Solution:
Audit plugins monthly
Remove unused ones
Replace 5 plugins with 1 good one
Use lightweight alternatives
Impact: 20-40% faster
Problem #3: Cheap Hosting (80% of small business sites)
That $5/month shared hosting?
You're sharing a server with 500 other sites.
When they're busy, you're slow.
Solution:
Move to quality hosting ($25-100/month)
Use CDN (Cloudflare, etc.)
Dedicated or cloud hosting for serious sites
Impact: 30-50% faster
Problem #4: Render-Blocking Resources
JavaScript and CSS that stops page from loading.
Solution:
Defer non-critical JavaScript
Inline critical CSS
Async loading
Code splitting
Impact: 25-45% faster
Problem #5: No Caching
Every visitor loads everything fresh.
Huge waste of resources.
Solution:
Browser caching
Server-side caching
CDN caching
Object caching
Impact: 50-70% faster for return visitors
The Core Web Vitals That Matter
Google measures three things:
1. LCP (Largest Contentful Paint)
How long until main content loads.
Goal: Under 2.5 seconds
Current average: 3.8 seconds
If yours is over 4 seconds, you're losing money.
2. FID/INP (First Input Delay / Interaction to Next Paint)
How quickly site responds to clicks.
Goal: Under 200ms
Current average: 280ms
Slow response = frustrated users = bounces.
3. CLS (Cumulative Layout Shift)
Do elements jump around while loading?
Goal: Under 0.1
Current average: 0.15
Layout shifts annoy users. Annoyed users leave.
The Speed Optimization Checklist
Here's what to fix, in order of impact:
Quick Wins (Do These Today):
✅ Compress all images
✅ Enable browser caching
✅ Use a CDN
✅ Minimize HTTP requests
✅ Enable GZIP compression
Impact: 40-60% faster in 1 day
Medium Effort (This Week):
✅ Audit and remove unused plugins
✅ Minify CSS and JavaScript
✅ Defer non-critical JavaScript
✅ Optimize database
✅ Implement lazy loading
Impact: Additional 20-30% faster
Big Moves (This Month):
✅ Upgrade to quality hosting
✅ Implement advanced caching
✅ Optimize code structure
✅ Use modern image formats (WebP)
✅ Code splitting and async loading
Impact: Additional 20-40% faster
Total potential: 60-80% faster than current
The Testing Tools You Need
Don't guess. Measure.
Free Tools:
Google PageSpeed Insights
Tests desktop and mobile
Shows Core Web Vitals
Gives specific recommendations
GTmetrix
Detailed performance report
Waterfall chart
Optimization suggestions
WebPageTest
Advanced testing
Multiple locations
Film strip view
Pingdom
Simple speed test
Geographic testing
Performance history
Use all four. Each shows different insights.
The Page Speed Budget
Every element on your page has a "cost."
Budget your speed:
HTML/CSS: 50KB max
JavaScript: 150KB max
Images: 500KB total max
Fonts: 100KB max
Third-party scripts: 200KB max
Total page budget: 1MB or less
Current average page: 2.2MB
Stay under budget, stay fast.
What Professional Speed Optimization Costs
Let's talk real numbers.
DIY (Free but time-consuming)
Cost: $0
Time: 20-40 hours
Result: 30-50% improvement
Risk: Breaking things
Basic Optimization ($500-2,000)
Image compression
Plugin cleanup
Basic caching
Simple fixes
Timeline: 3-5 days
Result: 40-60% improvement
Professional Optimization ($2,000-8,000)
Complete audit
Image optimization
Code optimization
Advanced caching
CDN setup
Database optimization
Timeline: 1-2 weeks
Result: 60-80% improvement
Enterprise Optimization ($8,000-25,000)
Everything above plus:
Custom code optimization
Server configuration
Advanced performance monitoring
Ongoing optimization
Timeline: 2-4 weeks
Result: 70-90% improvement
Most businesses need the $3K-8K tier.
Sweet spot for ROI.
The ROI Timeline
When do speed improvements pay off?
Immediate (Day 1):
Lower bounce rates
Better user experience
Improved Core Web Vitals scores
Week 1-2:
Conversion rate improvements visible
Revenue increase measurable
User feedback improves
Month 1-2:
Google rankings improve
Organic traffic increases
ROI becomes positive
Month 3-6:
Compounding effects
Higher rankings = more traffic
More traffic = more revenue
Most businesses break even in 2-4 weeks.
Then it's pure profit forever.
Real Client Transformation
Law Firm (Berlin)
Before:
Load time: 7.2 seconds
Bounce rate: 68%
Contact form submissions: 12/month
Mostly desktop traffic
Problems found:
Uncompressed images (15MB total)
38 plugins installed
Cheap shared hosting
No caching
Render-blocking scripts
What we did:
Compressed images (down to 800KB)
Removed 24 unnecessary plugins
Moved to quality hosting
Implemented advanced caching
Fixed render-blocking issues
Optimized database
After:
Load time: 2.1 seconds (70% faster)
Bounce rate: 39%
Contact form submissions: 31/month
Better mobile experience
Oliver Schmidt (Owner): "We've received numerous compliments, and our contact form submissions have increased significantly."
ROI:
Investment: $6,500
Time to complete: 2 weeks
Increase in leads: 158%
Value of additional leads: ~$48K/year
Paid for itself in 6 weeks.
The Mobile Speed Gap
Desktop vs mobile performance is shocking:
Average desktop load: 2.5 seconds
Average mobile load: 8.6 seconds
That's 3.4x slower on mobile.
And 60% of traffic is mobile.
You're slow for most of your visitors.
Mobile optimization must-haves:
✅ Responsive images
✅ Touch-friendly buttons (44px minimum)
✅ Simplified navigation
✅ Reduced animations
✅ Optimized for 3G/4G networks
✅ Progressive Web App features
Don't just make desktop fast.
Make mobile FASTER than desktop.
The Hidden Costs of Slow Sites
Speed doesn't just affect conversions.
Other costs:
Lost SEO Rankings
Slower sites rank lower.
Lower rankings = less organic traffic.
Estimated loss: 20-50% of potential traffic
Damaged Brand Perception
Slow = unprofessional.
Users judge quality by speed.
Impact: Hard to quantify but real
Higher Ad Costs
Slower landing pages = lower Quality Score.
Lower Quality Score = higher CPC.
Impact: 20-40% higher ad costs
Lost Return Visitors
79% of dissatisfied users won't return.
Impact: Lifetime customer value lost
Server Overload
Slow sites use more resources.
More resources = higher hosting costs.
Impact: 15-30% higher hosting bills
When Fast Enough Isn't Enough
Your site loads in 3 seconds.
That's "good" by industry standards.
But your competitor loads in 1.5 seconds.
Guess who wins?
Speed is relative.
You need to be faster than competitors.
Competitive analysis:
Check your top 5 competitors' speeds.
Your goal: Be in the top 3 for speed.
If you're not, you're losing customers.
The Bottom Line
Every second of load time costs money.
The math doesn't lie:
1-second load = 3% conversion rate
5-second load = 1.2% conversion rate
For a $100K/month business:
Fast site: $100K revenue
Slow site: $40K revenue
Difference: $60K/month = $720K/year
Speed optimization cost: $3K-8K
ROI: 9,000-24,000%
That's not a typo.
At BSLabs, we've optimized dozens of sites.
Every single one saw revenue increases.
Average improvement: 60-80% faster load times
Average conversion increase: 40-85%
Average ROI: 800-2,500%
Want to see how fast YOUR site could be?
Get a free speed audit — We'll test your site, show you exactly what's slow, and what it's costing you.
No sales pitch. Just honest analysis and real numbers.
Because here's the truth:
Every day your site is slow, you're losing money.
Your competitors are getting faster.
Can you afford to stay slow?
Ready to stop losing $2,500/month?
Let's make your site lightning fast.
BSLabs — Fast website and app development for businesses that mean business. No cheap work. No endless delays.
© 2026 BSLabs | webdevdesignz.com. All rights reserved.